Examples
A question. A figure.
These are genuine R outputs generated from synthetic data. They demonstrate ways to explore measurements; they are not empirical findings or private researcher results.
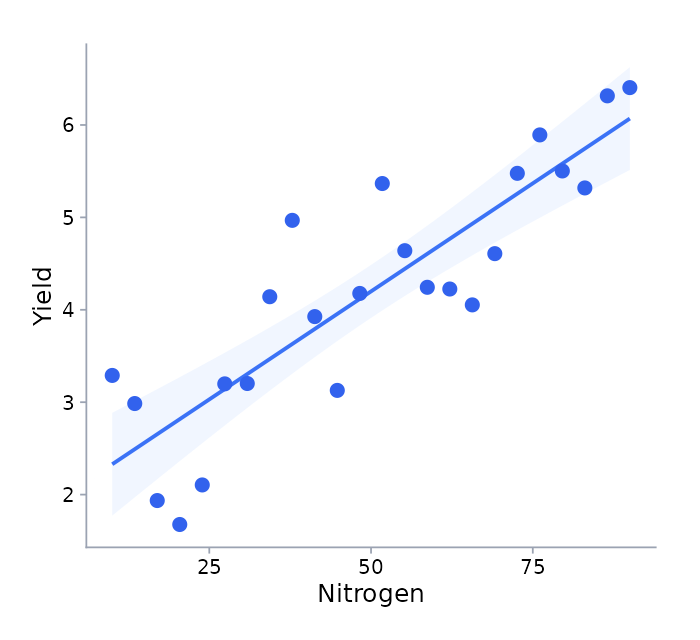
Relationships · scatter plot
How do two measurements relate?
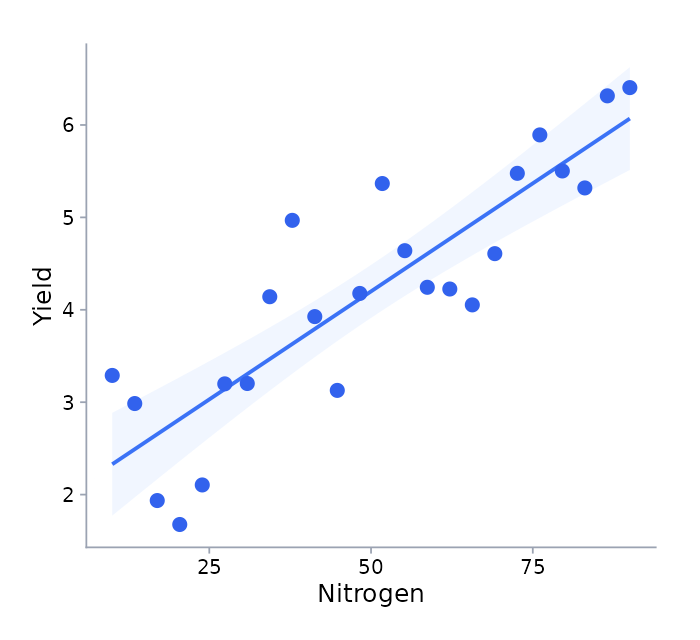
A scatterplot places one numeric measurement against another. Here, 24 synthetic observations were generated with an increasing relationship and random variation.
What to look for
The direction of the pattern, variation around the fitted line and observations that sit away from the main trend.
What it does not establish
This synthetic trend provides no evidence about a real treatment or population. A fitted line alone does not establish causation or validate model assumptions. No measurement units are assigned to these illustrative axes.
Distributions · box plot
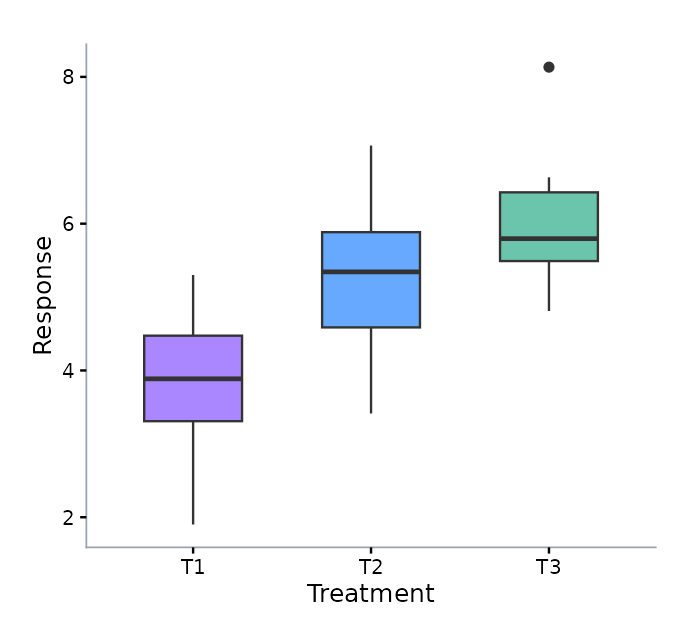
What differs across groups?
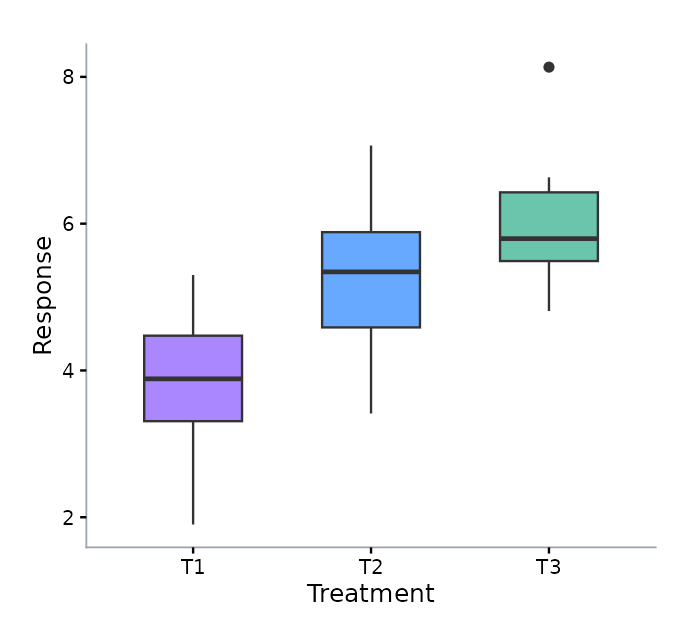
Boxplots summarize the distribution of observations within groups. This example uses three synthetic groups generated with different means and variation.
What to look for
Compare the median lines, the central spread and the whiskers. A boxplot makes differences in distribution easier to inspect.
What it does not establish
Visual separation is not a significance test. Any analysis of real data must account for the experimental units, design, assumptions and relevant uncertainty.
The source is part of the example.
Both examples use R with ggplot2 and ragg, with random seed 27. Download a standalone R script that generates the data and renders both figures. Package and font versions can affect the precise appearance.
Try the starter datasetBring your own question.
Create an account, verify your email and request workspace access.